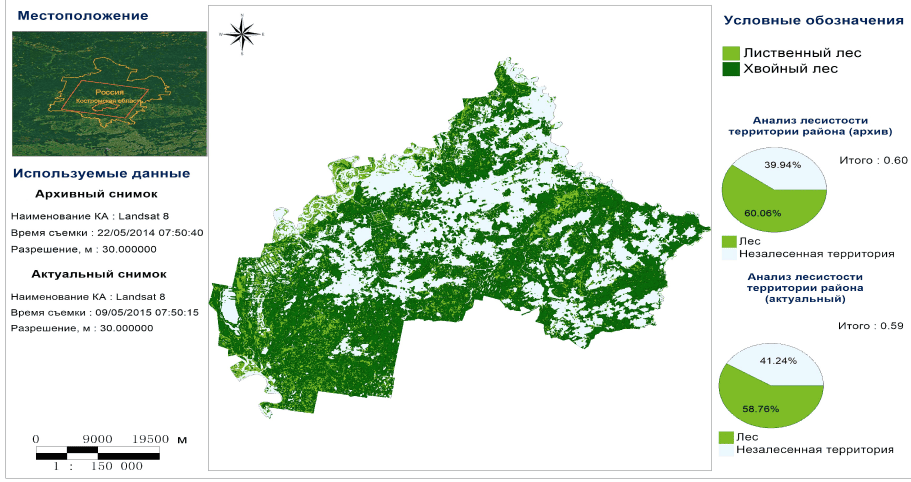
Разновременной анализ
Подробный обзор инструмента
для проведения разновременного анализа


Что это такое?
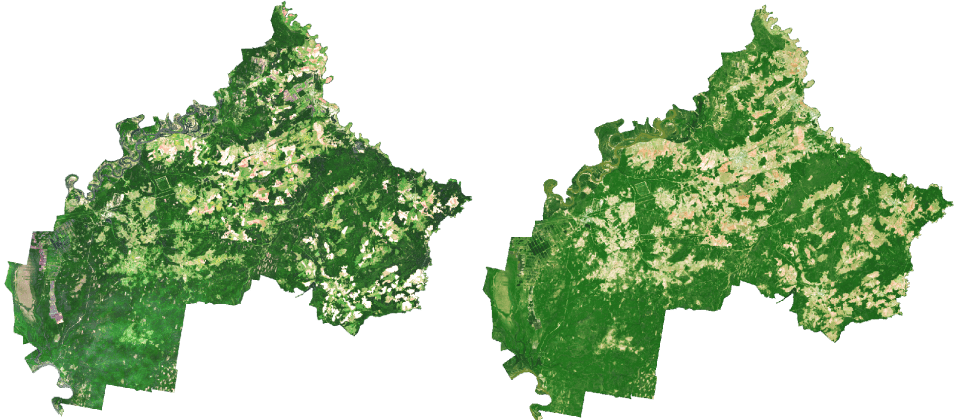
Благодаря дистанционному зондированию имеется возможность получать снимки одной и той же территории через определенные интервалы времени, что позволяет отслеживать динамику изменений наблюдаемых процессов.
Главными достоинствами данных, получаемых путем космической съемки, являются их достоверность, объективность и независимость от любых субъективных факторов.
Разновременной анализ может служить достоверным источником важной информации для многих ведомств и предприятий.
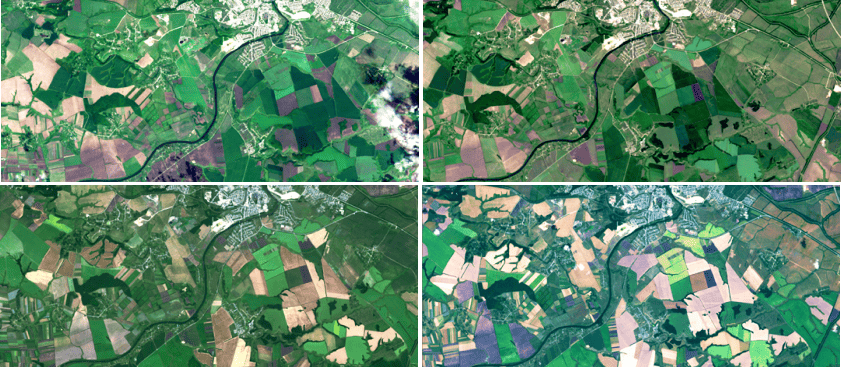
Чем может помочь
разновременной анализ
Разновременной анализ используется используется для:
- мониторинг чрезвычайных ситуаций;
- мониторинга изменений населённых пунктов и дорожной сети для нужд картографии;
- наблюдения за состоянием полей и посевов в агробизнесе;
- мониторинга изменений ледников;
- наблюдение изменений в градостроении;
- отслеживание изменений в сфере экологии;
- мониторинг изменений инфраструктуры в нефтегазовой промышленности и др.
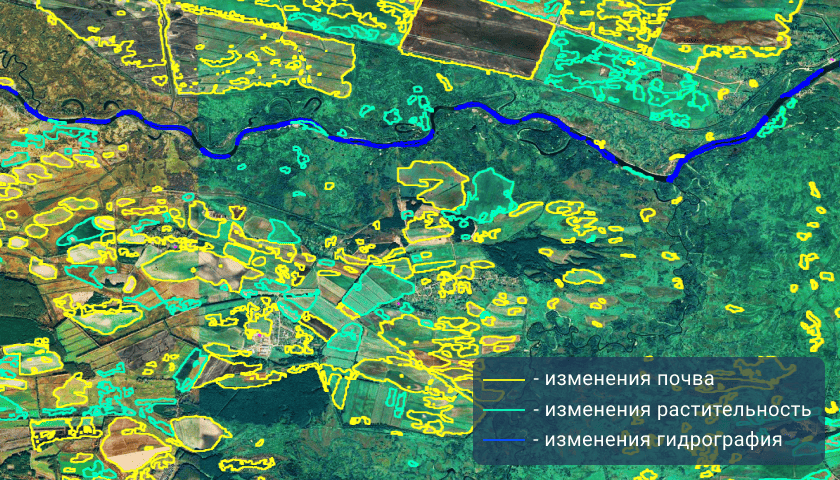
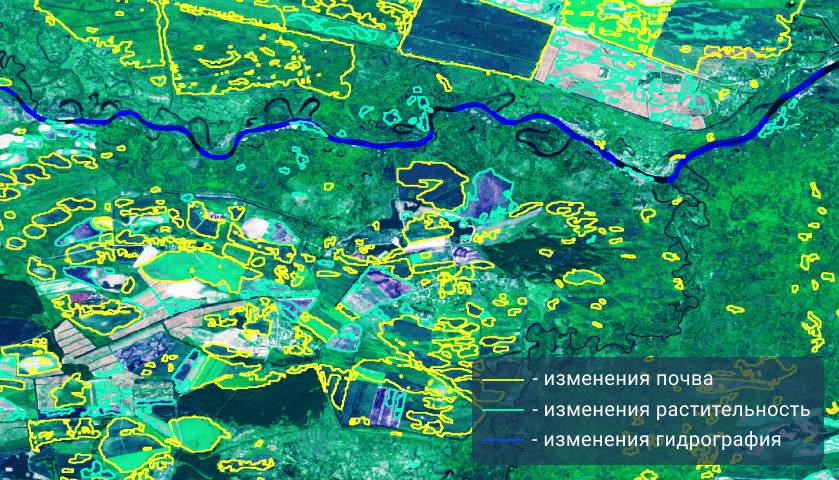
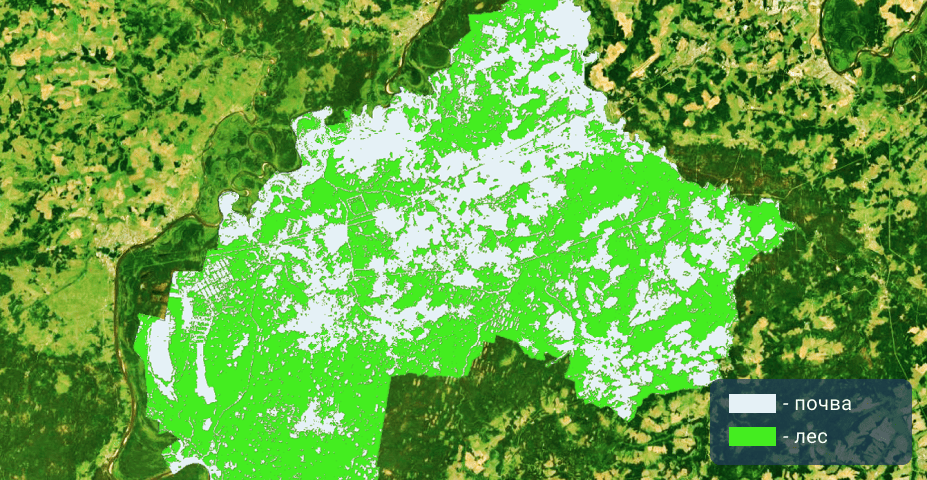
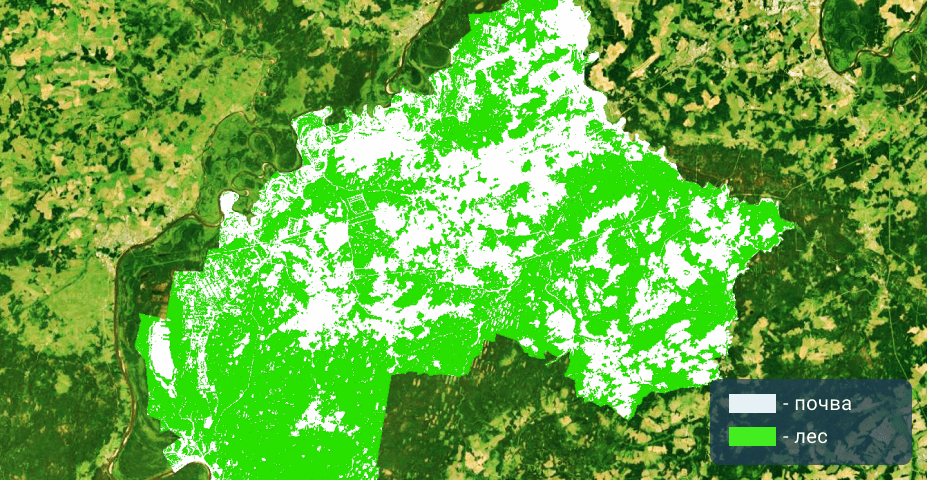
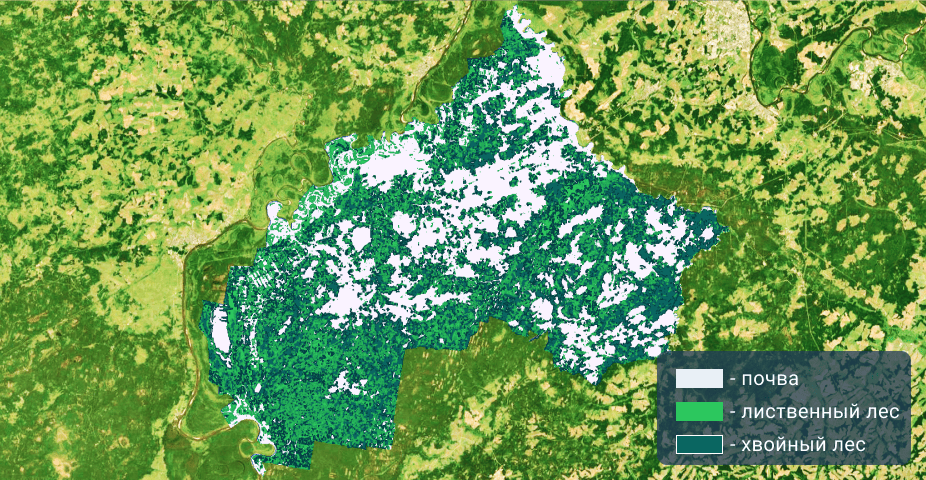
Пример выполнения разновременного анализа
В ПК IMC разновременной анализ проводится разными способами, в зависимости от конкретной тематической задачи. Программный комплекс имеет возможность обрабатывать огромный объем данных с использованием алгоритмов параллельной и распределённой обработки.
Наиболее распространенные методы обнаружения изменений на местности:
- вычитание разновременных снимков;
- получение многовременных индексов;
- цветовой синтез разновременных снимков;
- метод анализа главных компонент (PCA);
- сравнение результатов классификаций объектов по снимкам за разные сроки;
- последовательное сопоставление разновременных карт.
